


For the first big blog post, I thought we would take a look a some of the statistics of our school and compare them to nearby class A schools, the state of Minnesota as a whole, and our country. Our goal for this post is to look at how we are doing statistically. What are we doing right, and what can we improve on? We will be looking at a variety of different topics including: demographics, graduation rates, proficiency standards, MCA test scores, future success rates, college enrollment rates and much more. This may sound dry, and I’ll try my best to make this as interesting as possible, but I think it is important to show the strict data and add commentary when needed. (I’ll add pictures)
For this post, I’m going to focus mainly on the high school since we will be talking graduation and college prospects. Also, I’m going to use the public schools closest to us. No need to look at private. If you would like to dig into these statistics more, they can be found of the Minnesota Department of Education’s Website. Follow the link HERE.
If you really don’t want to read the whole thing (because you are feeling lazy right now), you can skip to “The Point” section at the end.
Demographics
I’m sure you guessed this, but BBE is very white. Around 90% white in the high school and 87% in the elementary, according to the Minnesota Department of Education. We are as white as the winter snow that just doesn’t want to go away. The rest of the student body consists mostly of hispanic students; 8% in the high school and 12% in the elementary. There is a 1% slice for both schools that includes the small amount of students that don’t fit those two categories.

What does this mean? Nothing much right now. Our current student enrollment, as of October 1st, is 627 students for both schools. That number has been slowly decreasing as the many years have gone by. Sure, there are some classes that are abnormally large or small, but we’re talking on average. This is a trend in many rural Minnesota districts, not just small schools like us. While not a problem now, it very well could be in these next twenty years. How can we increase enrollment numbers? That is a question for another time.
Graduation Rates
According to the Minnesota Department of Education, BBE graduated 41 students or 95% of the senior class. The year before, we graduated 86% of the senior class with 44 students. Over the last five years, our graduation rates average out to the lower nineties percentage wise. That is above the Minnesota statewide standard which sits around 81%, and the national average is around 83%.

(The chart’s max percentage went to 125%. Why? I have know idea. Sorry about that.)
What does this mean? At first glance, our numbers look stellar! We are higher than the state average and the national average by pretty large margins. Although, look closely. We have a very small school. It should be within our reach to have all kids graduate, especially in today’s world. While sometimes a kid not graduating is out of our control, we should keep striving for 100%
Also, high graduation rates do not equal student or school success. (HARD TRUTH ALERT) Minnesota is known nationwide as having one of the best educational systems in the country. Yet, our graduation rate is lower than the national average. Why? Our state’s requirements for graduation are harder than many others. Just because kids are graduating from high school does not mean they are on a plan for success. Does our high graduation rate mean our standards are too easy? No, that’s not how statistics work. For that, we need to look at our proficiency rates and test scores.
Proficiency
Let’s get serious. According to the Minnesota Department of Education, last year 71% of our high school students were proficient in reading, 66% in math, and only 49.5% in science. The elementary fairs better with 73% in reading, 73% in math, and 80% in science respectively. Proficiency means that a student can understand a subject’s concepts and apply them accordingly depending on their grade level.

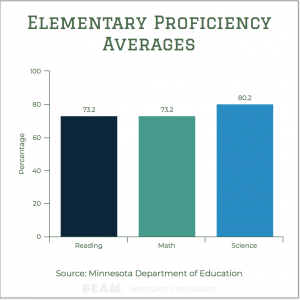
(High school on the left. Elementary on the right.)
High school rates looks bigger because the graph only goes up to 80%. The elementary goes to 100%.
Over the last five years, the elementary school has kept proficiency rates steady around the mid-seventies. The high school has seen steady increases in reading and science. In 2013, the high school’s science proficiency was at 23% (OUCH). While it has more than doubled in the last five years, it still has a long way to go. How do we compare statewide? For reading and math, a little better compared to the 60% average. For science, a little worse compared to the 55% average.

This is all better than our national averages though. According to the National Science Foundation, only 23% of American students are proficient in mathematics and only 20% are proficient in science. Look at Alabama, their proficiency rate for math was 17%, according to the Public Research Council of Alabama. Even with that low of proficiency, Alabama’s graduation rate is 89.9%. So why are so many kids able to graduate in Alabama with such low proficiency? Their requirements are much lower than ours. Some of our average students could have equal proficiency rates to their very best students, hypothetically speaking.
If you have ever wondered why the United State lags behind most of the developed world in education rates, there is your answer. Since each state sets its own academic graduation requirements and curriculum subject standards, we have some schools excellently preparing kids for careers in science and mathematics, and some that struggle to provide students with basic educational materials. The resulting average is not great.

(Minnesota ranks 7th)
Test Scores
You hate it. The kids hate it. We hate it. Everyone hates testing. But, like taxes, they are very necessary. When it comes to MCA test scores, we fair pretty well. The high school is the left chart, and the elementary is on the right. There is a lot going on in these charts. Take a look for yourself. Basically, the more dark blue and green, the better.

Some highlights I’ll point out are the science rates reflected from the proficiency rates. Only 49% meets or exceeds the science standards. The same amount of high schoolers only partially meets the standards or not at all. Not great. The elementary sees over 75% of its kids meeting or exceeding standards. Keep in mind, though, that science is not as intensely required in elementary as it is in high school. Especially, in the younger grades, science education is very basic compared to the focus that is put in math and reading (which can be understood, but not ignored). What about how we compare to the rest of Minnesota?
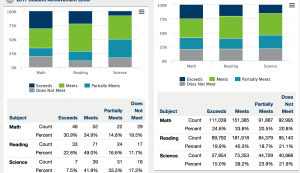
(BBE on left, statewide average on right)
We are exceeding the state average in math and reading and behind statewide scores in science. Nothing much more here that we haven’t discussed already. There are no national test comparisons for MCA scores since they are Minnesota specific.
Bored? Me too. MOVING ON!
Going to College
According to the MDE, of BBE’s 45 graduates in 2016, 34 went on to (and stayed) in a place of higher education. That makes our college enrollment rate around 76%. Not bad at all. Given the fact that college is not always necessary for every career, it is encouraging to see a large percentage of students continuing their education. Minnesota as a whole is not far behind with a college enrollment rate of 71%.
Growth
Ready to get a little dense? Growth is a relatively new aspect in school success rates. Here is a definition from the MDE’s Website. “The Minnesota Growth Model was designed with input from parents and educators to determine if students are gaining and maintaining skills necessary to be academically successful. Growth towards that goal is classified as low, medium or high. For each student in the state, scores from last year are compared to the current year. Expectations are set based on average improvements from year to year on statewide assessments. Students considered “on track” include proficient students who made medium or high growth and non-proficient students who made high growth.”
What?
Basically, this means that rather than looking just at proficiency, it looks at how much academic growth is expected from a student, grade, or school. So, I’m going to plop these charts down, and then we will talk about each one under it.
These are is growth rates for us and our neighboring schools from 2017.

This graph shows that, for the subject of math, about 60% of BBE high schoolers were on track for success in math based on their current and past test scores. That is slightly higher than the state average of 55%. The results are almost identical for reading. Compared to our neighbors, BBE is right in the middle of the pack.

This is showing how many of our high schoolers have a high, medium, low growth level. While our amount of high growth students is larger than the state average, the amount of low growth students is about the same. While not a worry now, hopefully that gap in achievement doesn’t grow larger.
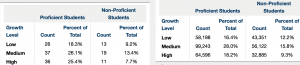
(BBE on the left. Statewide on the right.)
This is interesting. These are showing the breakdown of growth levels in proficient and non-proficient students. What these are trying to say is that growth level is not determined by how successful a student is now, but how successful they can be. Non-proficient students can have high growth, and proficient students can have low growth.
Growth can be a very important factor. Arguments are being made about how to accurately judge a school’s success rate. While the Department of Education currently look at just test scores, many are proposing additional aspects of judgement. One of the major factors being discussed is growth. Rather, than just looking at test scores, growth would look at if schools are demonstrating improvements in test scores or deteriorations.
Here’s an example. Last year, my school had average test scores in the 30th percentile, which means we are only partially meeting standards. Your school last year had average test scores in the 80th percentile, which means you were exceeding standards. This year’s testing results come in. Your school’s test scores went down and is now in the 65th percentile. My school’s test scores went up and are now in the 50th percentile. If looking at test scores alone, your school is still doing much better than mine, but incorporating growth shows that my school is doing better because our test scores are going up while yours’ went down.
When it comes to which schools get a larger portion of the states’ limited education funds, growth can play a huge roll. Even though a school’s test scores are high, a downward trend in growth could lead to issues with funding that comes from the state.
Keeping up with me?

The Point
This is where we are at right now academically at BBE schools. Some of the important points of this information would be:
- We have a very high graduation rate compared to rest of the state and country , but there is always room for improvement. Also, high graduation rates do not inherently mean that our school is successful.
- While our reading and math proficiency levels are at state standards, science is behind. This does not include all of the other subjects the BBE offers.
- MCA test score results are pretty much in line with our proficiency rates.
- Around three-quarters of our graduating seniors are attending higher education in some capacity.
- At least for the high school, BBE’s growth rate has about 60% percent of students on track for success. Whether a student in succeeding right now or not, all kids should be on track for success. Right now, compared with all the schools around us, we are in the middle. We want to be at the top!
Found any of this interesting? Want to make other people on the internet read a bunch of statistics? Share it with everyone! Also, leave a comment or ask a question to keep the conversation going!
Written by Cody Lenarz, Computer Technician at Belgrade-Brooten-Elrosa Schools